Recent issues
Vol. 5, Issue 6: Housing Age and Energy Efficiency – April 22, 2024 (PDF)
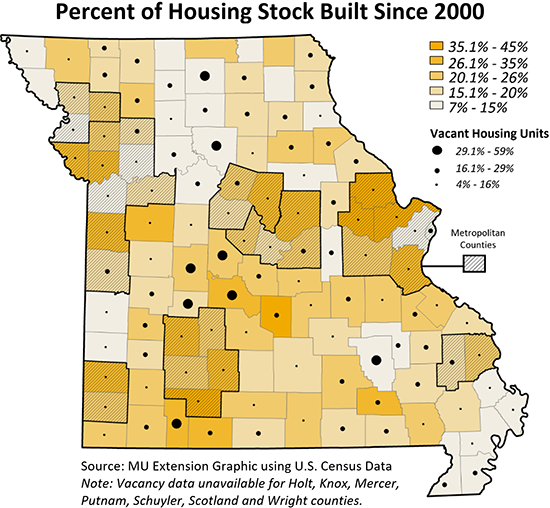
More than a quarter (26.9%) of Missouri’s houses were constructed before 1940, and more than half of Missouri’s housing stock was built between 1960 and 1999. Between 2020 and 2022, new construction added nearly 1.7 million units to the national housing stock, representing only 2% of owner-occupied homes.
Vol. 5, Issue 5: Aging Workforce: Trends & Challenges – April 1, 2024 (PDF)
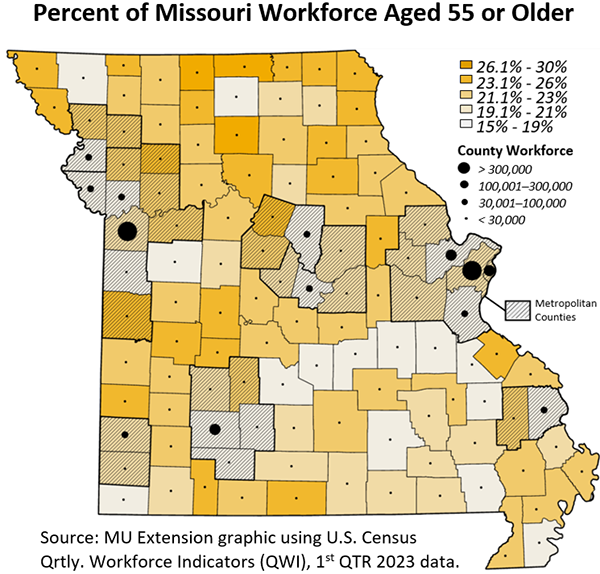
Between 2013 and 2023, Missouri saw a significant increase in its workforce aged 55 and over, growing by nearly 126,000—a 29% increase. In 2023, the 55+ working population accounted for 23% of the state’s workforce, up from 20% in 2013. Some industries, like agriculture, are especially vulnerable due to a higher concentration of older workers—25% are over 55 in Missouri; 32% across the U.S. Across the country, industries with the highest percentages of workers over 55 include manufacturing (28%), wholesale trade (28%), real estate, rentals and leasing (29%), and utilities (25%).
Vol. 5, Issue 4: Population & Migration – March 11, 2024 (PDF)
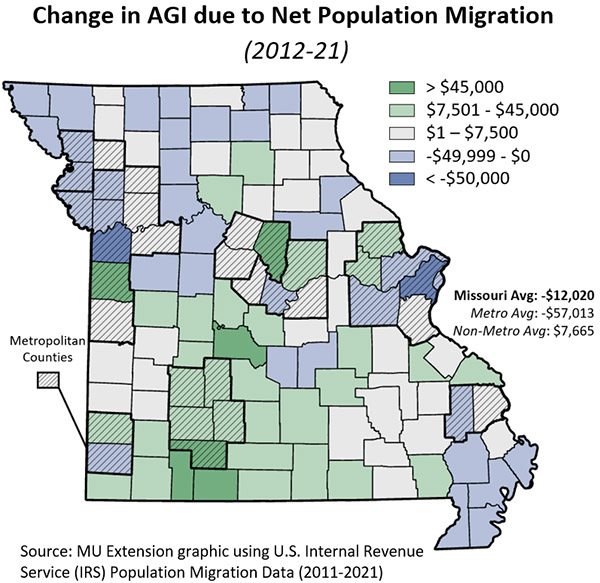
Between 2012 and 2015, Missouri saw significant out-migration, losing roughly 5,000 to 7,000 residents annually. However, since 2019, there has been a steady inflow of migrants, peaking with 11,178 in 2021. From 2012 to 2021, Adjusted Gross Income (AGI) outflows exceeded inflows by 3.9%, indicating an overall outflow of income from Missouri. A negative net AGI in Missouri implies that higher-income earners are leaving the state, while relatively lower-income individuals are arriving.