In December 2019, the U.S. Bureau of Economic Analysis (BEA) released county-level measures of gross domestic product (GDP) for the first time. GDP measures the total value of goods and services produced less the value consumed to produce those goods and services. Places where GDP is growing have expanding economies, and those with shrinking GDP have contracting economies. By producing these data for at the county level, BEA has provided an important barometer to gauge the health of state, metropolitan and local economies. This brief highlights some of the key GDP trends for Missouri and its regions.
In 2018, Missouri had a $319 billion economy1
- Missouri is the nation’s 22nd largest economy by GDP and 18th largest state by population.2
- Finance, insurance and real estate accounted for $61.7 billion (19.3%) of the state’s economy. It was the state’s leading economic sector.
- Other leading sectors included professional and business services (13.3%); manufacturing (12.2%); and educational services, healthcare and social assistance (10.5%).
- Government, which includes public schools, was responsible for $37.2 billion (11.7%) of the state’s economy.
- Missouri’s 36 metropolitan counties, including St. Louis City, produced almost 84% of the state’s GDP.
The St. Louis region was Missouri’s economic engine
- In 2018, the Missouri counties of the St. Louis, MO-IL metropolitan statistical area (MSA) generated $141.3 billion, which represented 44.3% of the state’s total GDP.
- Almost 80% of that activity occurred in St. Louis City and St. Louis County.
- St. Louis County generated one of every four dollars produced in the state.1
- The Missouri counties of the St. Louis, MO-IL MSA accounted for 75.8% of the metro’s total population but 83% of total metro GDP.
Other Missouri metro areas made significant economic contributions
- The Missouri counties of the Kansas City, MO-KS MSA produced $70.6 billion, which was 22.1% of Missouri’s GDP in 2018.
- More than two-thirds of this economic activity occurred in Jackson County.
- Jackson County was responsible for almost 15% of the state’s total GDP.
- The Missouri counties of the Kansas City, MO-KS MSA accounted for 57.9% of the metro’s total population but only 52.8% of total metro GDP.
- In 2018, the Springfield, MO MSA contributed $20.3 billion in economic activity to the state (6.4% of the state total). It was also home to 7.6% of the state’s population.
- Greene County produced 83.1% of the Springfield MSA’s GDP in 2018.
- Other metro contributions to Missouri’s state GDP included Columbia (3%), Joplin (2.4%), Jefferson City (2.4%), St. Joseph (1.7%), and Cape Girardeau–Jackson (1.3%).
Post recession, Missouri did not keep pace with other Midwestern and neighboring states
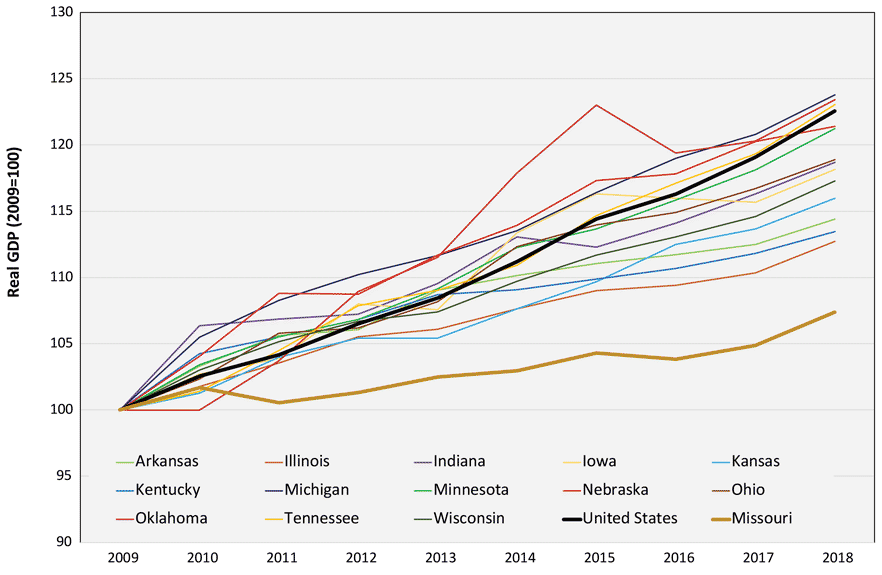
Figure 1. Real GDP Change in Midwestern and Neighboring States, 2009–2018. (Source: U.S. Bureau of Economic Analysis, chained 2012 dollars).
- Between 2009 and 2018, Missouri’s GDP grew just 7.4%—the lowest figure among neighboring and Midwestern states (Figure 1).
- The next closest state was Illinois. Its GDP grew 12.7% between 2009 and 2018.
- Between 2009 and 2018, Missouri’s compound annual GDP growth rate was 0.8%—almost a third of the U.S. annual growth rate (2.3%) recorded during the same period.
- Missouri’s GDP growth increased following 2016. The state’s economy grew by 1.7% annually between 2016 and 2018.
- Missouri’s annual growth rate during this period still lagged Tennessee (2.5%), Minnesota (2.3%), Michigan (2%), Indiana (2%), Wisconsin (1.9%) and Oklahoma (1.7%). However, it ranked ahead of neighboring states such as Kansas (1.5%), Illinois (1.5%), Arkansas (1.2%) and Iowa (0.9%).
- U.S. GDP grew 2.6% annually during this period.
GDP growth in Missouri’s metro areas lagged behind the average economic growth for U.S. metros
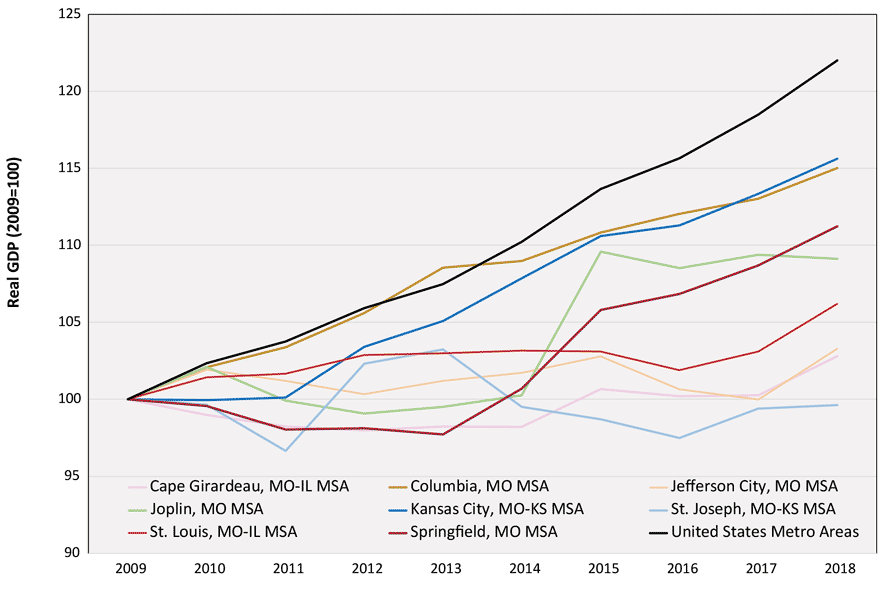
Figure 2. Real GDP Change in Missouri Metro Areas, 2009–2018. (Source: U.S. Bureau of Economic Analysis, chained 2012 dollars).
- Between 2009 and 2019 the economy in no Missouri MSA3 grew faster than the overall growth rate of all U.S. metros (2.2% annually) (Figure 2).
- Kansas City, MO-KS (1.6%), Columbia (1.6%) and Springfield (1.2%) were the only Missouri metros to exceed 1% annual growth since the recession.
- From 2016 to 2018, the pace of GDP growth picked up in the state’s larger metros including the St. Louis, MO-IL MSA (2.1%), Springfield MSA (2%) and Kansas City, MO-KS MSA (1.9%).
- Given the scale of its economic contributions, the St. Louis, MO-IL MSA and how its economy changes are perhaps most important for the state’s economic trajectory.
- Between 2009 and 2016, the St. Louis, MO-IL MSA grew only 0.3% annually, but its GDP grew 2.1% annually between 2016 and 2018.
- Joplin and Columbia were the two Missouri metros that experienced slower GDP growth between 2016 and 2018 than they did between 2009 and 2016.
- The St. Joseph economy did not grow from 2009 to 2018.
Missouri’s rural counties did not recover from the recession
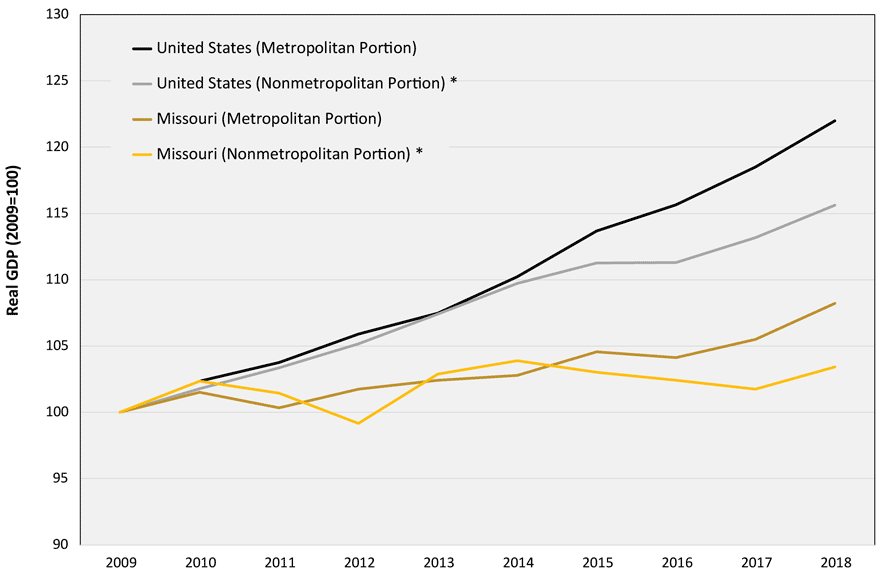
Figure 3. Real GDP Change in Metro and Nonmetro Counties, 2009–2018. (Source: U.S. Bureau of Economic Analysis, chained 2012 dollars).
- Following the recession, the gap between nonmetro counties in Missouri and nonmetro counties nationwide widened significantly2 (Figure 3).
- Real GDP in nonmetro counties nationwide increased 15.6% from 2009 to 2018, but real GDP in Missouri’s nonmetro counties only increased 3.4% during the same period.
- Both Missouri’s metro and nonmetro counties did not keep pace with their respective national counterparts, and the gap between the state’s metro and nonmetro counties began to widen.
- Between 2016 and 2018, GDP grew 1.9% annually in Missouri’s metro counties, but in Missouri’s nonmetro counties, GDP grew only 0.5% during the same period.
GDP grew in almost two-thirds of Missouri counties between 2016 and 2018
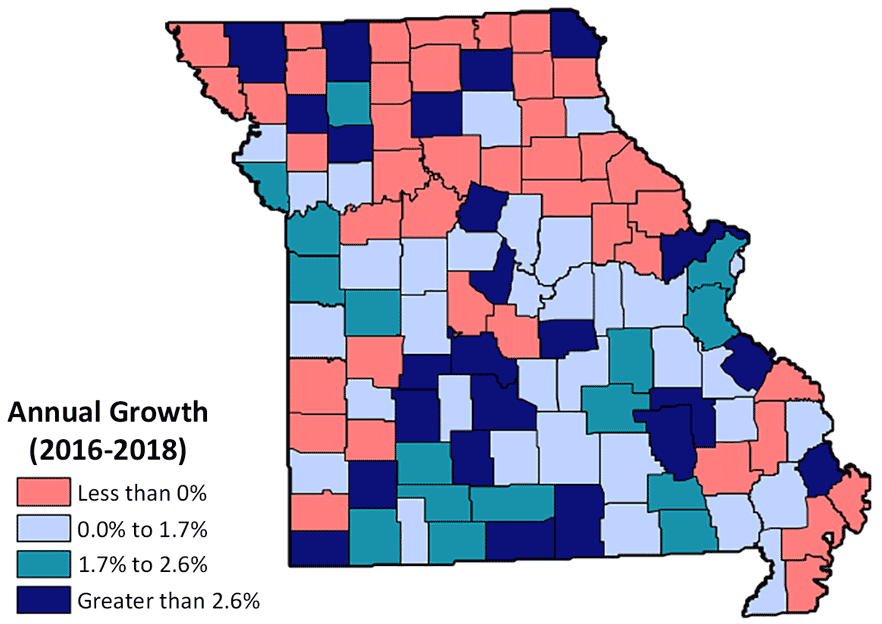
Figure 4. Change in Gross Domestic Product, 2016–2018. (Source: U.S. Bureau of Economic Analysis).
- Seventy-four of Missouri’s 115 counties, including St. Louis City, experienced positive GDP growth between 2016 and 2018 (Figure 4).
- This growth occurred primarily in Missouri’s urban counties and the southern half of the state.
- Of the 36 Missouri counties within an MSA, 29 experienced GDP growth between 2016 and 2018.
- GDP declined in many parts of northern Missouri and the Missouri Bootheel during this period.
- Of the 74 Missouri counties that grew their economies between 2016 and 2018, 38 of those counties lost GDP between 2009 and 2016.
- These counties included St. Louis City, Cole County (Jefferson City) and Buchanan County (St. Joseph).
Post-recession, 34 Missouri counties experienced both population and GDP growth
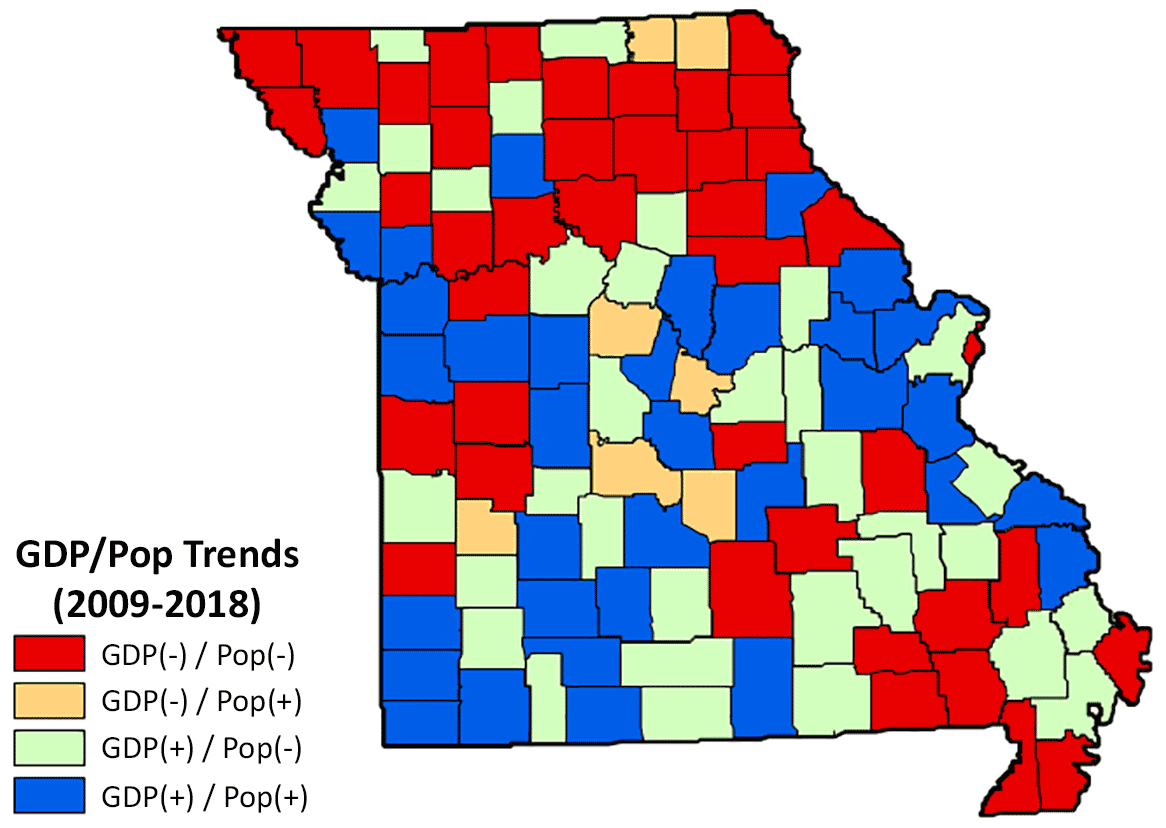
Figure 5. GDP and Population Growth Trends, 2009–2018. (Source: U.S. Bureau of Economic Analysis).
- Almost 30% of Missouri’s counties had population and GDP growth from 2009 to 2018 (Figure 5).
- These counties included Platte, St. Charles, Warren, Cass, Christian, Greene, Taney and Boone.
- Almost 29% (33 counties) of Missouri counties had GDP growth but population declines between 2009 and 2018.
- This group included the state’s largest county—St. Louis County—and counties such as Buchanan and St. Genevieve.
- Nationwide, more than 6% of counties grew in population but lost GDP during this period; this pattern was consistent in Missouri.
- Among the seven counties to gain population but lose GDP were Cole, Camden and Pulaski.
- Forty-one counties (36% of Missouri counties) lost both GDP and population since from 2009 to 2018.
- These counties were concentrated primarily in the northern and southeastern parts of the state.
- Other areas around the country with concentrations of similar counties included Central Appalachia (West Virginia, eastern Kentucky, southwest Virginia), the Mississippi Delta region and northern New Mexico.
Endnotes
- GDP statistics for 2018 are current dollar statistics in that values are shown in 2018 dollars. GDP measures that show change over time were calculated using real dollars, meaning that they are inflation-adjusted.
- Population statistics are drawn from the U.S. Census Bureau’s Population and Housing Unit Estimates (V2018).
- This analysis does not include the Fayetteville-Springdale-Rogers, AR-MO MSA because the only Missouri county in that MSA is McDonald County, which represented just 2.4% of the MSA’s 2018 total GDP.