Yield monitors are an essential component of many site-specific management strategies. Yield maps, the visual and numerical product of yield monitors, encourage creative investigation and can provide reliable answers to carefully performed on-farm experiments. Yield maps provide feedback for determining the effects of managed inputs such as fertilizer and lime, seed and pesticides, and cultural practices such as tillage, irrigation and drainage.
A yield monitor is most useful when used together on a combine equipped with a differentially-corrected global positioning system (DGPS) receiver (Figure 1). The yield monitoring system simultaneously records yield, grain moisture and position data — the essential data necessary to produce yield maps.
Each color or shade on a yield map represents a range of productivity or crop yield (Figure 2). Yield maps can increase awareness of the magnitude and location of yield variability within a field. Patterns of variabilityprompt investigation of soil properties and other features of the field. It has been said "yield maps confirm the memories that you should have had."
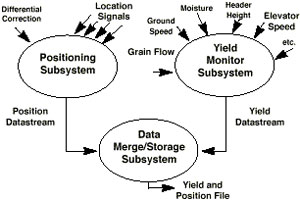
Figure 1
Components of a yield monitoring system.
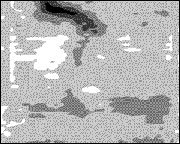 Figure 2
A map with soybean yields from 10 to 50 bushels per acre.
Yield monitoring system example
Many yield monitoring and mapping concepts are best learned by following an example. For this publication, consider a combine equipped to harvest six 30-inch rows, operating at 5 mph and harvesting corn with an average yield of 120 bushels per acre. This combine requires about 15 seconds before grain entering the header is fully flowing into the grain tank.
Yield monitoring systems
Yield monitors typically provide a periodic report of yield. The operator can usually select the amount of data that is collected (e.g. 1, 2 or 3 second intervals).
The combine, in the example, collecting data on 2-second intervals, has a resolution of 0.005 acre and collects about 200 yield measurements per acre. Yield monitors typically provide more data points than any other precision agriculture tool.
Limitations of yield monitors
A yield monitor measures the rate at which clean grain is entering the grain tank. Threshing and separating systems cause a large delay between the time grain enters the combine header and the time it passes through the clean grain elevator. Combines also smooth abrupt changes in yield; hence, the yield monitor measures delayed averages of yield.
The phenomenon of delay and smoothing are both most obvious when a combine enters or leaves the crop at the ends of a field. The combine, in the example, has a delay of 15 seconds and would travel 110 feet and harvest almost four hundredths of an acre before an accurate or stable yield is displayed on the yield monitor.
Most yield mapping software can make a correction to the yield data that compensates for delays caused by the combine. The resulting yield map will not be perfect, but it will be very adequate for observing the magnitude and location of yield variability.
Yield and moisture sensors
A sensor in the stream of clean grain measures the mass flow.
Yield sensors measure
- The force of the grain hitting a plate
- The attenuation of light passing through the grain stream
- The weight of the grain collected for a period of time
- The volume of grain passing through a paddle.
The most common method is to measure the force of the grain striking a plate located at the top of the clean grain elevator (Figure 3). The accuracy depends on the elevator speed, the type of crop and the moisture of the grain.
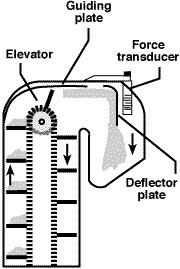 Figure 3
Mass flow sensor.
Yield and moisture data are collected simultaneously to obtain corrected yield. Moisture sensors are often located in the clean grain elevator or the clean grain auger. Most sensors measure the capacitance of the grain and can provide continuous moisture data (Figure 4).
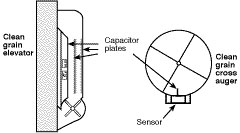 Figure 4
Moisture sensor installation.
Grain passing over the moisture sensing plate can leave deposits that can affect moisture readings. Manual measurements should be taken periodically to check the performance of the moisture sensor, especially when operating in severe conditions that can coat the sensor with soil or plant sap. High moisture readings from a dirty sensor will underestimate yield.
The yield monitor console
The yield monitor console (Figure 5) is a data collection unit and computer that records data from the yield sensor, moisture sensor and DGPS receiver. The console is also used to enter field names, grain type, calibration numbers, correction factors and other user-specified data.
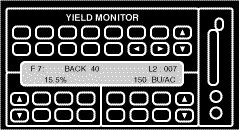 Figure 5
Yield monitor console.
The console may also monitor or record elevation, elevator speed, ground speed, swath width, header height (for switching the unit on and off) and electronic flags manually set by the operator. Electronic flags are often used to record the location of weeds known to be highly correlated with yield reductions. These flags may also help in managing other problems such as rocks, terrace failures, standing water, etc.
A yield monitor equipped with a DGPS receiver stores data in a format that includes position information. These spatially indexed data are later used to produce maps of yield, moisture, elevation or maps of any other information collected during harvest. Most yield monitors can display instantaneous readings of yield and moisture and provide statistics for loads or batches of grain from a field or within an area of a field.
Some consoles are designed for multiple purposes and can be used during other field operations such as variable rate planting or spraying.
Data collection and storage
Data is often recorded on removable memory cartridges, such as a PCMCIA card, which can be downloaded to a computer. Data should be downloaded daily to ensure that the yield monitor is working properly and to protect from accidental loss.
Memory cards may store several megabytes of data. The capacity of the cards is sometimes stated in hours of operation since data is typically stored on a periodic basis (Table 1). One megabyte of memory can store 15 to 45 hours of information for yield data collection intervals of 1 to 3 seconds.
Table 1
Logging time for logging intervals of one to three seconds.
| Logging time, hours | |||
|---|---|---|---|
| PCMCIA memory | Logging interval | ||
| 1 second | 2 second | 3 second | |
| 1M card | 15.7 | 31.5 | 47.3 |
| 2M card | 33.8 | 67.6 | 101.4 |
| 4M card | 69.8 | 139.7 | 101.4 |
| 5M card | 78.5 | 157.0 | 235.5 |
Yield monitor calibration and accuracy
A yield monitor must be calibrated to provide accurate yield data. Calibration must be performed for each type of grain harvested at the beginning of the harvest season. Accuracy usually improves when several loads are used to perform the calibration. Re-calibration should be performed as necessary, especially later in the season as average moisture content drops or when there is a significant change in crop conditions.
Calibration is usually as simple as weighing and recording the moisture of the first several loads collected under a variety of conditions, such as various operating speeds or grain flow rates; consult the operator's manual for specific instructions.
The accuracy of a yield monitor depends not only on its design, but on how carefully the calibration procedure is followed. Some companies offer a training session or video tapes to teach calibration. These procedures vary considerably among manufacturers, but all require carefully recording the weight of grain, which can become a logistical problem on some farms.
Operating a combine equipped with a yield monitor
The final appearance of a yield map depends on how the combine is operated. Frequent stopping or sudden changes in speed can cause erratic yield data due to the delay and smoothing phenomena associated with the combine separating system.
The combine must be operated on a uniform swath width to ensure accurate yield data. The width of the header must be manually entered into the monitor to accurately calculate yield. Yield will be underestimated if fewer rows are harvested. Many yield monitors allow the operator to change the number of rows or the percent of width harvested to correct yield for point rows or field edges.
Yield monitor installation and service
A yield monitor is a precision electronic device that requires careful installation to operate properly. Improper installation of cables usually just causes the monitor to be inoperable. Improperly installed sensors can cause faulty yield data.
When purchasing a yield monitor the base configuration should include moisture sensors, data recording capability and the ability to use existing sensors for clean grain elevator speed and ground speed, if possible.
Consider the value of installation and service from a dealer or the manufacturer — many new combines are factory-equipped with yield monitors. Dealer support and the ability to upgrade may be an important consideration in the selection of a yield monitor.
Yield monitor maintenance
Because a yield monitor is an electronic device, little or no maintenance of the monitor console should be needed. However, the sensors may require periodic cleaning and inspection to ensure they are in proper operating condition. Calibration checks should be performed periodically to determine the accuracy of yield and moisture data.
Moisture sensors are more likely to need cleaning under harsh conditions, but yield sensors may also collect debris that can affect accuracy of the sensor. If moisture or yield readings seem to change suddenly without a logical reason, stop the combine and check the sensors for dirt or plant sap. Spot-check moisture with a moisture meter to determine if there is a problem with the on-board moisture sensor. Weigh a load of grain to determine if there is a problem with the yield sensor. Unusual moisture or yield readings, or sudden changes should not be ignored.
Producing yield maps
Printed yield maps are the most common product resulting from the use of yield monitors. Data may also be used in management software to make decisions when used in combination with other data. There is a big difference between creating a yield map and using the data to make decisions.
Basic mapping software may be included free or for a small charge with the purchase of a yield monitor. Geographical information system (GIS) software that allows data analysis and provides tools for making decisions may require a considerable financial investment. This type of service is often available from an agricultural service provider.
The purpose of a yield map is to provide a useful visual picture of the location and magnitude of yield variability. Each color or gray shade represents a yield range. Each range need not necessarily be the same size, but some symmetry should probably exist around the average yield.
Colors should be selected from a natural or logical system that is easily remembered such as the color spectrum. For example, the following colors, which are used to represent the numerical values 0 to 9 may be used to represent 10 yield ranges.
The number and size of ranges should be selected to provide useful information about yield variability while minimizing complexity. A map containing too few ranges will not provide much useful information, while a map that contains a large number of small ranges may be so complex that it is difficult to use.
Managing site-specific data
Yield maps provide a permanent visible record of harvested yields. However, yield variability from a single year does not provide enough information to determine long-term trends in productivity. Variables such as soil fertility, rainfall and weed pressure need to be considered during analysis.
Keep the original data used to make maps in at least two safe places. Although a map may have already been produced, the original data will probably be required again, especially as new management and decision-making software is adopted or as computing systems are upgraded. As several years of data become available, confidence in understanding the causes of variability will increase and past data will have tremendous value.
Long-term yield records are useful for evaluating the productivity and profitability of a soil and the appropriateness of the cultural practices used to grow a crop. Although yield variation within a field is usually the result of differences in soil types or soil properties, weather patterns usually have the largest effect on variability. The value of yield data should be considered limited for the first three to five years until enough data has been collected to account for yield variability caused by weather.
Site-specific management strategies
Site-specific strategies for improving productivity and profitability have common elements related to soil characteristics, topography and past management practices. These strategies often have at least some general relationship to yield maps.
- Where the topsoil has uniform physical properties, but some management practice has created an inequity in nutrient status, a variable rate application strategy may place higher rates of nutrients in areas with lower yields and relatively lower rates in the areas with higher yields.
- Where the topsoil has varying physical properties, such as soil type or soil depth, the yield potential will vary considerably throughout the field. Past management practices of uniform nutrient applications may have created excess nutrient accumulations in areas with low yield potential and nutrient deficits in areas with high yield potential. A variable rate application strategy will generally place higher rates of nutrients in areas with higher yield potential and lower rates of nutrients in areas with lower yield potential.
- Where controllable factors such as weed pressure and drainage limit yield, modifications to management or renovations to the land should be used to improve productivity if the long-term benefits out-weigh the costs.
Summary
Yield maps are only as accurate as the data collected to produce them and only demonstrate that yield variability exists. Monitors must be correctly installed and periodically checked to provide accurate data.
Yield map data should be used with soil test data, scouting notes and other observations to learn why variability exists. The knowledge gained from site-specific crop management equips farmers to make better management decisions that have positive environmental benefits and that result in improved productivity and profitability.