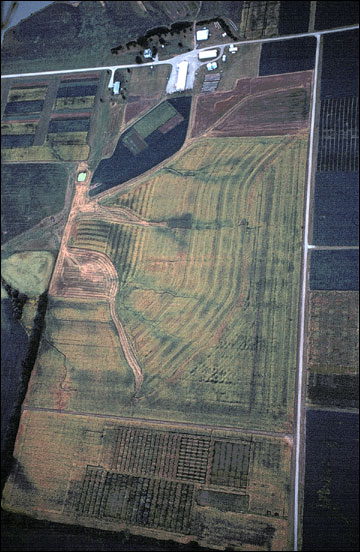
 At left, modern aerial photographs show true-color images of crop canopies and signs of soil variability.
Remote sensing for agriculture can be defined simply as "observing a field or crop without touching it." Although remote sensing can be as simple as a "windshield survey" of a field from a truck at 55 mph, the history of modern remote sensing began when black-and-white photographs of the landscape were first taken from the air. The first organized effort to acquire aerial photographs appeared in the late 1930s by the Department of the Army. Eventually the Agriculture Stabilization and Conservation Service adopted the technology and began collecting indexed photographs of the landscape for agricultural purposes. Many of these photographs are still available through the Farm Service Agency. Remote sensing, today, incorporates new technologies that provide increasingly efficient, complete, accurate, and timely information. These new technologies, together with historical photographs, provide the informational basis for a practical management tool for site-specific management of crops.
Remote sensing technologies provide a diagnostic tool that has at least two important functions as well as many other uses in site-specific management of crops. Remote sensing can be used to measure reflectance of light energy from the crop canopy, which may be useful in detecting plant stress while there is still time to correct the problem. The pictures or maps created with remote sensing also provide a quick method for estimating the extent of an important crop characteristic or the location of areas of a field that appear to have similar characteristics. These images or maps are useful in developing scouting plans for direct examination of the detected soil or plant conditions and in developing site-specific treatment plans.
Like yield maps, remotely sensed images encourage creative investigation of long-term management practices. Remotely sensed images provide a visual method for understanding the effects of managed inputs such as fertilizer, and cultural practices such as tillage. They are also useful in understanding the impact of environmental factors such as drainage or pest infestations. In contrast to yield maps, which affect only future decisions, remotely sensed images may be collected several times throughout the growing season, and allow timely management decisions to correct problems or deficiencies in the current crop. For this reason, remote sensing technology adds an important dimension to site-specific management of crops.
Historical aerial photographs
Historical aerial photographs can provide valuable insight into the current state of the land. These photographs are typically black and white and provide a good example of the simplest form of remote sensing. It is becoming increasingly common to place a value on these historical records and to exchange them as though they are a part of the land as the land changes hands. The photographs can help landowners visualize historical differences in land use that occurred years or decades earlier.
1939 photograph.
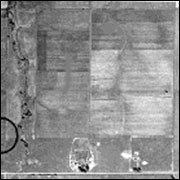
1956 photograph.
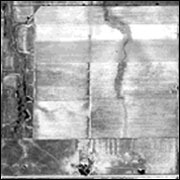
1968 photograph.
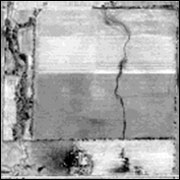
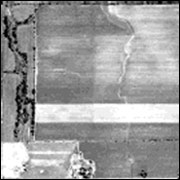
1982 photograph.
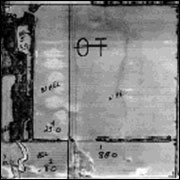
1990 photograph.
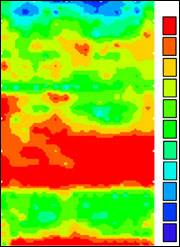
Figure 1
A remotely sensed digital image, above, indicating variability in soil pH in a field reflects differences in farming practices over the years, as shown in this series of historical aerial photographs.
A primary example of the significance of these records is related to consolidation of farmland. Average field size has grown in the last several decades by consolidating fields once farmed separately into larger fields that are more efficient to manage. When adjacent pastures and tilled fields are consolidated, those once-separate tracts do not behave the same under the new, uniform management strategy. The result is a large field with abrupt changes in soil characteristics or productivity at the junction of old and otherwise invisible field boundaries. An old photograph can provide information that can be used to understand that variability.
In the following series of photographs (Figure 1), the map of pH from an approximately 80-acre field has a distinct pattern that appears to have developed from farming the larger field as several smaller fields. The map from 1990 clearly shows a tree line separating the field into two distinct parts. The photo from 1982 provides even more clues to some of the differences in pH. Here, evidence of gully erosion from the south end of the field to the north end also appears to have been at least partially responsible for variability in pH due to erosion and deposition and supports the idea that dramatic topsoil movement has occurred within the field. It is also apparent that this field was once part of a larger field that extended to the west and that a farmstead in the southwest corner has caused at least minor variability in the pH map. The photo from 1968 provides few if any additional clues to the variability in pH but clearly demonstrates that past practices caused differences in the canopy of the current crop and that the large field from the 1982 photo had previously been divided as it is now. Finally, the photos from 1956 and 1939 provide evidence that the differences in pH today result from differences in farming practices half a century ago.
Old aerial photographs can also remind or inform a manager of the removal of old farmsteads, shallow ponds, railroad tracks and fences. These features often indicate areas of marked differences in past management. Areas where management practices, including amounts and types of lime, fertilizer, manure and tillage can continue to cause variability in crop growth for many years after fields are consolidated. Historical aerial photographs are available at local Farm Service Agency offices. Photographs that date back to the 1950s and some that date back as far as the late 1930s are often available.
Modern aerial photos and digital images
Archival aerial photos are useful for detecting possible effects of historical management practices. Modern aerial photographs of the current crop can help detect variability due to more recent management practices and problems including poor drainage, weeds, insects, nematodes and diseases.
Most analysis of remotely sensed data is performed on a computer with digital images. The images can be acquired by digitizing photographs from film cameras or directly with digital cameras and other specialized electronic instruments. A photograph that has been digitized is represented by hundreds of thousands or millions of dots called pixels (picture elements) and is stored electronically. Digital cameras record reflectance with arrays of tiny sensors and store images directly, without the use of photographic film. Light filters, advanced electronic sensors and special-purpose film can be used to collect light energy invisible to the human eye and from specific portions of the electromagnetic (EM) spectrum. Through these technologies, remote sensing with digital images can provide significantly more and different information than black-and-white photographs can provide. It is important to have a basic understanding of light to appreciate the variety of technologies used in remote sensing.
Electromagnetic spectrum
Figure 2
Visible light at the red end of the spectrum has a longer wavelength (lower frequency) than light at the violet end.
Visible light is electromagnetic energy, which travels in the form of waves. The colors we see are due to differences in the frequency or wavelength of this electromagnetic energy (Figure 2). The colors of a rainbow are a readily apparent example of light from the visible region of the electromagnetic spectrum; these colors are red, orange, yellow, green, blue and violet. Red light has the longest wavelength of all visible light. Wavelengths are often reported in nanometers (nm), a unit of measure equal to 1 billionth of a meter. The visible portion of the spectrum ranges from about 700 nanometers (the red end of the visible portion of the spectrum) to 400 nanometers (the violet end of the visible portion of the spectrum).
Visible light is only a small portion of the electromagnetic spectrum (Figure 3) that may be useful in analyzing soils and crops. Infrared light, characterized by wavelengths larger than those in the visible spectrum, ranges from 700 nm to 100,000 nm. In particular, reflected infrared light, ranging from 700 nm to 3,000 nm, is useful in remote sensing to detect stress in growing plants. Some adjacent regions of the spectrum also have significance in remote sensing. These include the longer wavelengths of the microwave region from 1 mm to 1 m and the shorter wavelengths of the ultraviolet region, with wavelengths shorter than the violet end of the visible spectrum (400 nm). Smaller yet are X-rays and other forms of radiation. Wavelengths longer than those in the microwave region are used for radio broadcasts.
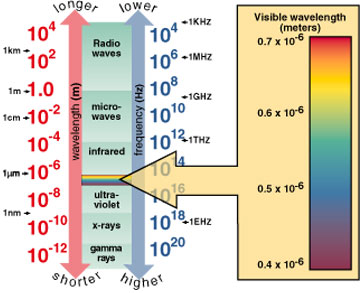 Figure 3
Visible light is a relatively narrow band in the electromagnetic (EM) spectrum. Remote sensing measures reflectance of EM radiation both inside and outside the visible range.
Reflectance properties of soil, water and plants
For most applications, cameras and similar instruments rely on the energy from the sun to illuminate the surface to be photographed. Light is transmitted, absorbed or reflected depending on the properties of the materials it strikes. Eventually, all light is either absorbed by some object or reflected. Light energy that is absorbed is converted to heat. Reflected light can be recorded by photographic film or electronic sensors.
When the sun's energy strikes a surface, the amount and type of reflectance depends on the composition of the surface it strikes and the angle of incidence. For example, light-colored soil reflects more sunlight than dark soil. Conversely, dark soil absorbs more of the sunlight energy and warms up more quickly. Bodies of water have different reflectance characteristics than bare soil, and the quality of the reflectance varies with the depth and turbidity of the water.
Total reflectance from plant surfaces varies throughout the season and throughout the day as sun energy changes. However, the most useful information is provided by differences in reflectance among the various portions of the EM spectrum. These differences in reflectance along the entire EM spectrum can be used to distinguish healthy vegetation from necrotic or stressed vegetation. Various factors, including drought, nutritional deficiency, disease, nematodes and herbicide injury can reduce or alter the chlorophyll content and other substances that affect the reflectance of the vegetation.
Chlorophyll absorbs most of the light from the red and blue portions of the visible spectrum but reflects green wavelengths; hence leaves appear green when chlorophyll content is high. When leaves lose chlorophyll, there is less absorption and proportionately more reflection of the red wavelengths, making the leaves appear red or yellow (yellow is a combination of red and green wavelengths). The internal structure of healthy leaves also reflects near-infrared light; hence near-infrared reflectance is an excellent measure of the health of crop vegetation.
Filtering techniques are sometimes used to capture reflected light from one or more specific portions of the spectrum that are highly correlated to important plant characteristics. The ratios of reflectance from among these specific types of light can serve as "fingerprints or signatures" for detecting soil, water and crop characteristics important in crop management. Hence, the colors or shades on a map developed from remotely sensed data could represent either true colors or false colors. False colors provide either a visual representation of specific, directly measured reflectance properties or categories of certain combinations of reflectance properties that represent a high probability of a particular condition, such as stress caused by nutrient deficiencies, diseases or drought.
Collecting remotely sensed images
In most cases, the process of collecting and processing remotely sensed data is best suited to commercial organizations or specialists who can afford to invest the time and financial resources necessary to develop reliable techniques for data collection. By spreading costs over a large area or among a large number of farms, commercial enterprises can afford to offer images using the best technology available.
Specialized photographic and electronic technologies
Photographic film is basically of two types — panchromatic and color. Panchromatic film, which is used to provide black-and-white images, is sensitive to visible light as well as infrared light up to 900 nm and ultraviolet light down to 300 nm. Normal color film consists of three layers sensitive to red, green and blue light and produces photographs that look normal to the eye. Color-infrared (CIR) film is also a three-layer film but is sensitive to infrared, red and green light. When processed, CIR film results in a "false color" image in which the infrared light is printed as red, red light is printed as green, and green vegetation appears blue. The remaining blue light often offers little useful information. Multiband photography uses multiple lenses and various combinations of films and filters to record simultaneous photographs of the landscape from several small or discrete spectral ranges.
Several technologies are in use to gather reflectance data electronically. The terminology used to describe these technologies often includes prefixes such as multi- and hyper- to indicate approximately how many separate bands of reflectance are measured. The term multispectral typically implies that about four relatively wide bands of reflectance are measured, while the term hyperspectral usually implies that something on the order of 100 relatively narrow bands of reflectance are measured.
Digital cameras and multispectral scanners record data through the use of charge-coupled devices (CCDs). Digital cameras use an array of CCDs sensitive to various portions of the EM spectrum to provide snapshots of the landscape, while multispectral scanners record successive narrow sweeps of light as the field of view of the instrument moves across the landscape. Multispectral reflectance data are typically collected as three or four spectral bands in widths of 10 to 100 nanometers. Lens-mounted filters are used to separately record light energy from two or three portions of the visible spectrum (red, green and blue light) as well as near infrared light. Hyperspectral reflectance data typically include more than 100 narrow spectral bands with very narrow bandwidths and provide a wealth of information, but processing requirements currently limit hyperspectral data to research efforts.
Commercially available reflectance data are collected using either fixed-wing aircraft or satellites that provide a platform for the sensing equipment. The data are spatially indexed so that georeferenced images of a field can be generated. The quality or value of remotely sensed data is related to spectral, spatial and temporal resolution.
Spectral resolution is the degree to which the wavelengths of light in the spectrum are separated. Various types of sensors are used to collect reflected light from several portions of the EM spectrum. A black-and-white (gray scale) image has low spectral resolution because it is composed of light from throughout the visible spectrum, but the colors are not sorted out. In contrast, a color image has higher spectral resolution. In practice, filters and multiple sensors are used to collect light from many narrow portions of the EM spectrum to provide high spectral resolution.
Spatial resolution is the amount of detail in an image. The difference between good and poor spatial resolution can be thought of as the ability to detect small objects. For example, an observer looking at an image with poor spatial resolution may be just barely able to detect the presence of a vehicle on the landscape but may not be able to distinguish a tractor from a truck. The same observer using an image with high resolution may be able to detect features small enough to distinguish between the two objects.
Spatial resolution of remotely sensed images is typically 2 to 4 meters per pixel, which is usually adequate to detect important surface features. Occasionally, aircraft are flown at lower altitudes to provide higher resolution on the order of 0.5 meter per pixel. The image width or "footprint" narrows with lower altitude as well as with the use of zoom lenses.
Temporal resolution is the difference in time between successive images. Images acquired just a few days apart provide the ability to detect changes in reflectance that can indicate the onset of stress in a crop. Temporal resolution is limited by the number of times aircraft or satellites are scheduled to pass over the landscape.
Cloud cover is a limitation for both fixed-wing aircraft and satellites. Clouds over the landscape shade the surface to be viewed, both changing the characteristics of incident and reflected light and blocking a clear view of the landscape. Hence, temporal resolution is also reduced if good images cannot be obtained because of poor weather.
Commercially available remote sensing products
The types of commercial products available for remote sensing vary considerably from maps of raw data to maps that represent specific information. For example, some companies offer products that include online access to raw images and separately available tools for measurement and analysis. Image sizes include 1, 2, 3 and 6 square miles with resolutions of 1, 4, 5, 10, and 15 meters, depending on the product. Image types include black-and-white, color, and color infrared. Most of these products are developed from existing data less than three years old. Other products can be made available for a future date and must be ordered about two weeks in advance.
Some companies offer products designed to provide specific information about a crop or field. Some of these products are based on reflectance measurements with little or no processing. In other cases, the products are estimates of a specific condition that has been developed by applying formulas to selected reflectance measurements to estimate that condition (Table 1).
Table 1
Examples of commercially available remote sensing products.
Products and suggested uses
- Soil brightness
Construct soil maps or direct soil sampling - Crop vigor or health
Several uses - Vegetation cover
Replant decisions - Chlorophyll content
Nitrogen management - Yield prediction
General management - Weed escapes
Weed management - Stress due to canopy
Irrigation management moisture deficits - Crop residue
Evidence of compliance with erosion prevention guidelines
A list of commercial sources of remote sensing data designed for agriculture is maintained at the Missouri Precision Agriculture Center (MPAC).
Image interpretation: Ground truthing and directed scouting
Aerial imagery provides an efficient way to monitor crop development, to determine the extent of stressed areas, and to detect patterns due to management practices in a field. Because remote sensing data typically average the reflectance from a relatively large area that may include several plants, the exact cause of variability is usually not clear from the images alone. In most cases, only manual inspection from the ground can provide a reliable explanation for the variability. Ground truthing is the act of physically going to a field to determine the cause of variability detected in an image.
Directed scouting is another benefit of remotely sensed data. Printed images can provide some guidance in locating specific areas of interest within a field, but if the field is large and lacks internal points of reference, field scouting can still be a challenge in waist-high, drilled soybeans or in 10-foot-tall corn. Software is available that can download remotely sensed "georeferenced" images into a handheld computer. The handheld computer equipped with or connected to a portable GPS (global positioning system) receiver can guide directed scouting efforts.
At the specific area of interest, a plant pathologist or agronomist familiar with scouting techniques can look at differences in leaf color and patterns of damage to leaves and stems and quickly make an informed decision about the probable cause of the damage to a plant. Other examples of specific causes of variation include plant population, plant size and vigor. When differences in planting date, variety, seeding rate, seeding depth, herbicides and fertilizer applications are ruled out, the analysis might proceed to other factors such as differences in soil type, soil physical properties or soil profile, and drainage characteristics. Specific causes of variation related to the soil include depth of topsoil, presence of a claypan, perched water table, streaks of sandy or gravelly subsoil, tile lines, or historical differences in manure, fertilizer or lime application rates. Even if the cause of the difference is not determined, the information may still be important for future management decisions.
Tractor- and equipment-mounted sensors that measure electromagnetic radiation as equipment travels through the field are also being developed. These on-the-go sensors provide an alternative method for recording reflectance properties and offer the possibility of real-time adjustments of management practices. Specifically, radiometers are being used to measure the greenness of the canopy in crops such as corn to develop a method to automatically adjust side-dress nitrogen rates during application. Similar sensors are being developed to detect weeds for selective herbicide application and damage from insects in alfalfa for making pest management decisions.
Summary
Remote sensing technologies provide an important tool to aid site-specific management of crops. Remote sensing has the potential to provide real-time analysis of the attributes of a growing crop that can assist in making timely management decisions that affect the outcome of the current crop. However, like other precision agriculture technologies, the information gained from remote sensing is more meaningful when combined with other available data. For this reason, even historical photographs can take on new value.
Incorporating remote sensing into your management activities requires discipline and will require new management techniques and technical skills. To be successful, remote sensing must be accompanied by a good conventional scouting program and the benefits of the improvements in management must outweigh the cost of the technology as well as the additional time spent in management.